Before and After Game-Aware CI
Before and After Game-Aware CI
This is the document your tech lead has been trying to write for six months.
The one that explains — in numbers, not vibes — why your CI needs to change. The one with actual before-and-after data from a game studio, not a SaaS company.
We wrote it for them.
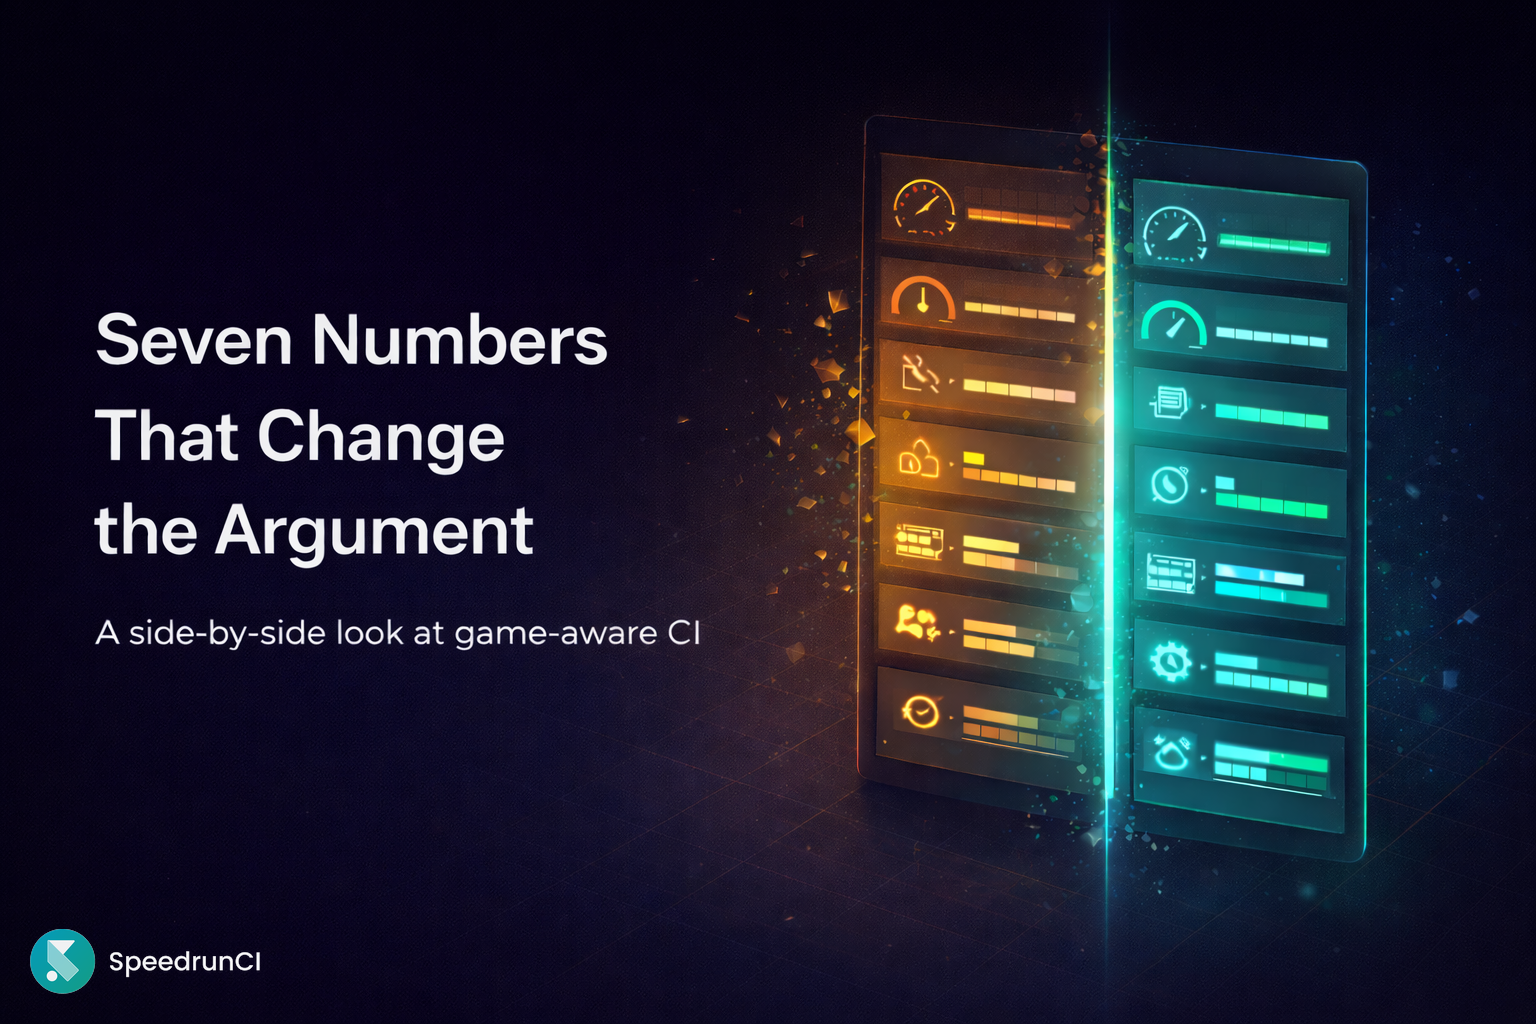
Seven dimensions. Measured before and after. From a studio that switched.
Why Your Studio Doesn’t Have This Data
DORA metrics are standard in SaaS DevOps. The 2024 State of DevOps Report surveyed 39,000+ professionals.
Game studios are barely represented.
DORA’s “elite” benchmark for deployment frequency is multiple deploys per day. That makes sense for a web app. It’s meaningless for a studio shipping one game every three to five years. So studios look at the framework, decide it doesn’t apply, and stop measuring entirely.
No measurement means no baseline. No baseline means no proof. No proof means no purchase justification.
Joe Vogt, IT Manager at The Coalition — the team behind Gears of War — put it simply: “You can spend a third of your day doing nothing.” Everyone felt it. Nobody had the numbers.
So we measured. Here’s what the “before” actually looks like when you write it down.
The Before: Seven Dimensions, Exposed
1. Build Time
2-4 hours for a full UE build. Ayelet Studio’s baseline: 3hr 32min. Milestone’s baseline before optimization: 107 minutes. Multiple Epic Developer Community Forum threads report 4-5 hours as typical. Nobody calls it a crisis because it crept up gradually.
2. Failure Rate
Unmeasured. No studio we talked to tracks build failure rate as a metric. Failures are investigated one at a time and then forgotten. The response to a failed build is “re-run it,” not “log it.”
When builds fail, the failure is monolithic — the whole pipeline collapses, and the logs point somewhere inside a 200-step process. Root cause analysis is manual excavation.
3. Recovery Time (MTTR)
Hours to days. The Coalition’s developers opened levels 4-5 times daily, spending up to 30 minutes each time on shader compilation alone. When a nightly build breaks on a Friday, it stays broken until the one person who understands the Jenkinsfile is available Monday morning.
Generic CI pipelines don’t tell you where they failed. The failure could be in the compile step, the cook step, an environment variable, a stale cache, or a plugin incompatibility from last week’s Jenkins upgrade. You debug by elimination.
4. Team Size Maintaining CI
1-2.5 engineers. Some studios hire full-time build engineers whose entire role is pipeline maintenance. Others spread the burden across senior engineers — who then aren’t working on the game. One thread about Jenkins alternatives put it bluntly: “Keeping a Jenkins instance running can easily turn into a full-time job.” Juggling controller and agent ratios, backing up databases, working weekends for upgrades. That’s a description of Jenkins maintenance, not game development.
5. Manual Steps per Deployment
Uncounted. Build locally. Package manually. Upload to Steamworks. Distribute 100GB builds via Google Drive. Increment the version number — or forget to and do it again. Nobody automates the last mile because the pipeline doesn’t reach it.
Scar tissue. That’s what these manual steps are — the scar tissue that forms when automation can’t reach the end of the process.
6. Who Can See Build Status
Engineers only. Artists commit and hope. Producers ask Slack. QA tests whatever build someone tells them is current. A developer who wrote extensively about Unreal CI nailed why: most CI tools aren’t built to filter information for non-engineers — “there tends to be information overload, both for engineers and more importantly, for non-engineers.” So studios build workarounds: badges in Unreal Game Sync, Slack bots that parse logs, shared spreadsheets tracking which builds are valid. All because the CI tool was designed for the person who configured it and nobody else.
7. Deployment Frequency
Nightly at best. Many studios do weekly or milestone-only builds. Ad hoc builds are common because the pipeline is too slow or too fragile for anything more frequent.
When a full build takes three hours and fails one out of four times, you don’t run it per-commit. You run it overnight and deal with whatever you find in the morning.
Seven dimensions. Most studios track one — build time. Some track zero.
The Cost You’re Already Paying
Build failures cost $50K+ per incident. The formula: (people affected x hours idle x fully loaded hourly cost) + rework + delayed milestone risk. A 50-person studio with a broken nightly build loses a full day of productivity for QA, artists waiting on valid builds, and engineers debugging the pipeline instead of the game. Twice a month and the annual cost is visible.
CI downtime — the slow kind, not the catastrophic kind — silently eats 10-15% of dev hours. Engineers waiting on builds, re-running flaky jobs, maintaining Jenkins, manually packaging. None of this shows up on a timesheet. All of it shows up in the milestone.
Up to 30% of game development costs come from inefficiencies. CI isn’t the only source. But it’s the one nobody measures, which means it’s the one nobody fixes.
Take your team size. Multiply by the hours per week lost to build waits, pipeline failures, manual distribution, and build-status questions. Multiply by your fully loaded hourly rate. That’s your current CI cost. Not the subscription fee. The human cost.
The After: Same Seven Dimensions, Different Numbers
The “after” data comes from Ayelet Studio — where we build Son of Thanjai in Unreal Engine 5 — and from pilot studios. The tool is Speedrun. We built it because the tool we needed didn’t exist.
This is pilot data, not enterprise-scale proof. But the direction has been consistent across every team that’s switched.
1. Build Time
27 minutes. Same hardware. Same repo. Same project that took Jenkins 3hr 32min.
The first full build won’t be 27 minutes — the cache needs to warm. Speedrun snapshots compiled code and cooked assets, then rebuilds only what changed. By week one, the difference is clear.
2. Failure Rate
Tracked and isolated. Failures pinpoint to specific nodes in the build graph — not monolithic pipeline collapses. One step fails. One log tells you why. One commit caused it.
Failures are precise. Boring, even.
3. Recovery Time (MTTR)
Minutes, not hours. Failure isolation means you fix one node, not debug the entire pipeline. The error message points to the step, the commit, and the log. You fix it and re-run that step. Not the whole build.
4. Team Size Maintaining CI
Zero dedicated build engineers. The pipeline reads the .uproject file and understands the dependency graph. Caching, parallelization, and orchestration are the platform’s job, not yours.
This is the dimension that surprised us most at Ayelet. We didn’t just save build time — we got engineers back.
5. Manual Steps per Deployment
Commit to storefront in one pipeline. Build, cook, package, deploy to Steam or Epic Games Store, notify the team. No manual packaging. No Google Drive. No “did you increment the version number?”
The last mile is automated because the pipeline was designed to reach it.
6. Who Can See Build Status
Everyone. Artists see their asset status. Producers see milestone progress without asking anyone. QA knows which build to test. Notifications go to Discord, Slack, or Teams — filtered by role, not dumped as a raw log.
The dashboard was designed for non-engineers first. Because the people who need build visibility most are the people generic CI tools exclude.
7. Deployment Frequency
Per commit, if you want. Nightly as a baseline. The pipeline is fast enough and reliable enough that frequency becomes a choice, not a constraint.
At Ayelet, artists started committing more often. Engineers stopped doing local builds “just to be safe.” The build stopped being a topic of conversation.
Here’s the side-by-side. Print it. Drop it in Slack. Attach it to the purchase request.
The Reference Table
| Dimension | Before (Generic CI) | After (Game-Aware CI) |
|---|---|---|
| Build time | 2-4 hours (full UE build) | 27 minutes (cached, same hardware) |
| Failure rate | Unmeasured; monolithic failures | Tracked; isolated to individual nodes |
| Recovery time (MTTR) | Hours to days | Minutes |
| Team size maintaining CI | 1-2.5 dedicated engineers | Zero dedicated engineers |
| Manual steps per deployment | Uncounted (local build, manual upload, Google Drive) | Zero (commit to storefront in one pipeline) |
| Who can see build status | Engineers only | Entire team (role-filtered notifications) |
| Deployment frequency | Nightly or weekly | Per commit (nightly baseline) |
Methodology Notes
Where the “before” numbers come from: Community forums (Epic Developer Community, Hacker News, r/unrealengine), developer blog posts (Jorgen’s Unreal CI series, Danny Goodayle on Horde), vendor case studies (Incredibuild/Milestone, Microsoft/The Coalition), industry reports (DORA, Cortex deployment survey), and direct conversations with studios. Representative ranges, not controlled experiments.
Where the “after” numbers come from: Ayelet Studio (daily production use on Son of Thanjai) and pilot studios (2 indie, 3 mid-size). The 27-minute build time is Ayelet’s measured result on the same hardware and repo that produced the 3hr 32min Jenkins baseline. Pilot results vary by project size but trend in the same direction.
What’s estimated vs. measured: Build time is measured. MTTR is measured (log timestamps). Team size is observed. Failure isolation is architectural — the build graph makes monolithic failures structurally impossible. Deployment frequency and manual steps are self-reported by studio leads. Historical “before” failure rates don’t exist because no studio was measuring them.
Where Speedrun is still maturing: Ecosystem breadth. Jenkins has thousands of plugins and a decade of community solutions. Speedrun is purpose-built for Unreal — deep on that vertical, narrow elsewhere. If your stack extends well beyond UE, evaluate accordingly.
What This Memo Is Really Asking
Your tech lead has been trying to write this document for six months. They live the problem daily. They know which stages are flaky and which workarounds are load-bearing.
The document never gets finished because there was no framework and no benchmarks. The tech lead starts a spreadsheet, fills in build time, stares at the other empty columns, and goes back to fixing the pipeline.
Now they have the framework. Seven dimensions. Benchmarks from a studio that measured both sides.
Either you measure your CI performance across these dimensions and find out what it’s costing you — or you keep paying the cost you’ve stopped counting.
Most studios will never measure. They’ll keep paying and call it normal.
Every week without this data, the number gets bigger. Quietly. The way it always has.
If you want to fill in your own numbers, we’ll help. abrahamk@speedrun.ci
Never miss a ue5-main update.
Get them delivered straight to your inbox.